The PropTrack Home Price Index shows that home prices continued to fall across the country in August, with regional markets recording their largest quarterly fall since 2011. The largest price falls continue to be in Sydney and Melbourne, with Sydney prices now below their level a year ago.
Here are the key highlights from the August 2022 report:
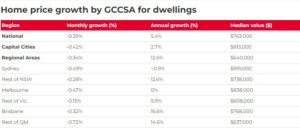
- Australian home prices fell in August, down 0.39%, and are now 2.7% below their March peak.
- Prices continued to decline in Sydney (-0.49%) and Melbourne (-0.47%). All capital city markets are now below price peaks, with Sydney prices down -0.87% over the last year, making it the only capital city to see a decline over the year.
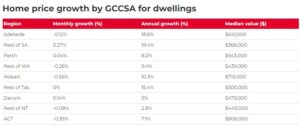
- Regional South Australia is the only market continuing to see significant growth, hitting a new price peak. Adelaide, which was the last capital city to record a price fall this year, is now the strongest performing market over the year.
- Combined regional areas fell 0.34% in August have now fallen 1.2% over the past three months – the largest quarterly fall since 2011.
- Despite recent falls, prices are still significantly above their pre-pandemic levels. Regional areas remain up almost 50% since March 2020. Capital city prices are up 26% over the same time period.
National price falls continue
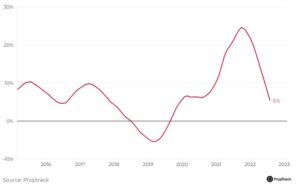
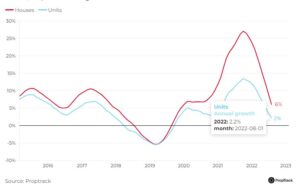
National home prices continued to fall in August. Prices have fallen 2.7% from their peak in March and have retraced all their 2022 gains, to be 1% down year-to-date.
Higher interest rates – and expectations they will keep increasing – have spread price falls across the country. We expect home prices to continue to fall throughout 2022 and into 2023 as reduced borrowing capacities are reflected in prices.
The pace of price falls so far is consistent with our expectation that national prices will be 2% to 5% lower over 2022. See the PropTrack Property Market Outlook for more.
Housing Price Growth – Australia
Annual, PropTrack Housing Price Index
Regional areas experience largest quarterly falls since 2011
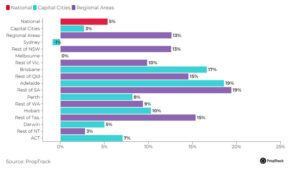
Regional areas saw prices fall 1.2% over the past three months, the most in a decade. But regional price growth has been stronger than the the capitals, up 12.6% over the year compared with 2.7% in capital cities.
Regional areas have benefited from relative affordability and preference shifts towards lifestyle locations and larger homes following the pandemic. These factors have buffered the regions, as well as the more affordable capitals of Brisbane and Adelaide, from the largest price falls so far.
Housing Price Growth
Annual, PropTrack Housing Price Index
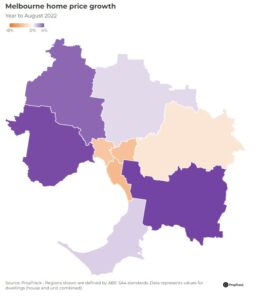
Sydney prices below their level a year ago
We continue to see the biggest price falls in Sydney and Melbourne, which saw further price falls of around 0.5% in August.
Sydney prices are now below their level a year ago, with Melbourne prices unchanged. From their peaks earlier in the year, prices have fallen 4.8% in Sydney, and 4.3% in Melbourne.
There is a clear trend across the country that prices are falling the fastest in the most expensive regions. Uncertainty about borrowing costs appears heightened where mortgage sizes are largest.
Annual Growth
Year to August 2022, all dwellings
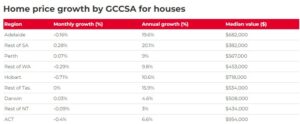
Prices in Adelaide fell for the first time this year – the last capital city to record a price fall in 2022. However, Adelaide is now the strongest performing capital city market over the past year (up 18.6%), overtaking Brisbane (up 16.6%). They remain far-and-away the strongest capital city markets, having benefited from many of the same lifestyle and affordability trends that have boosted the regions since the onset of the pandemic.
Regional South Australia is the only market continuing to see both significant growth and hit a new price peak in August.
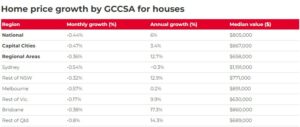
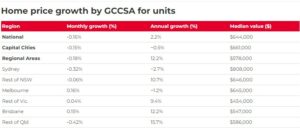
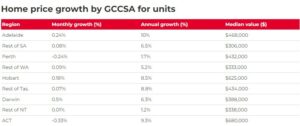
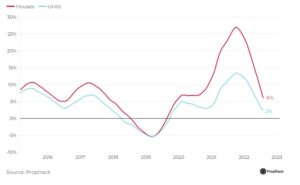
House prices fell 0.44% in August, with units down only 0.16%. The post-pandemic period has been typified by a desire for more space that has led to house prices (up 6% over the year) outperforming units (up only 2.2%). However house price growth has slowed very rapidly this year.
Housing Price Growth
Annual, PropTrack Housing Price Index
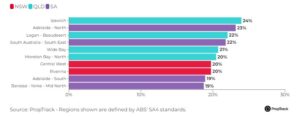
Most sought-after regions in the country topping 20% growth
Regions in Southeast Queensland, South Australia, and regional NSW topped the country to record growth above 20% over the past year. It’s clear that regions in South Australia and those peripheral to Brisbane have continued to benefit from population flows, with Australians taking advantage of remote work and more affordable prices in these locations.
Highest Growth Regions
Year to August 2022, all dwellings
Looking across the capitals, the outperformance of the peripheral parts of cities is clear. Higher willingness to pay for larger homes and the reduced commuting requirements, have seen these areas perform strongly since the onset of the pandemic.
Outlook
National prices have fallen persistently since March, with price falls now affecting all capital cities. So far, prices are down 2.7% from their peak, and by more than 4% in Sydney and Melbourne. Notably, Sydney prices are now below where they were a year ago, with Melbourne prices unchanged.
Annual price growth nationally, at 5.4%, is the slowest seen since December 2019.
Regional South Australia is now the only market seeing both significant price growth and setting new price peaks. Adelaide is the last capital city to record a price fall in 2022, and is now the strongest capital city over the past year.
Interest rate increases have been the overwhelming driver of home price falls. The RBA has raised rates at the fastest pace since 1994, with further large increases expected. This is significantly constraining borrowing capacity and increasing borrowing costs across all regions.
These interest rate effects will take time to fully affect prices, and will dominate the positive demand effects of stronger wages growth and immigration that we expect over the coming year.
That means we expect prices to continue to fall throughout 2022 and much of 2023.
The current pace of price falls is in line with our expectation that prices nationally will fall 2% to 5% over 2022. We continue to see the largest falls in Sydney and Melbourne, and expect the greatest total price falls in these markets.
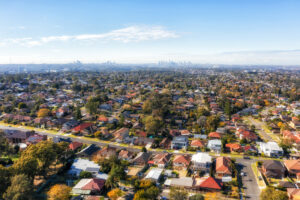
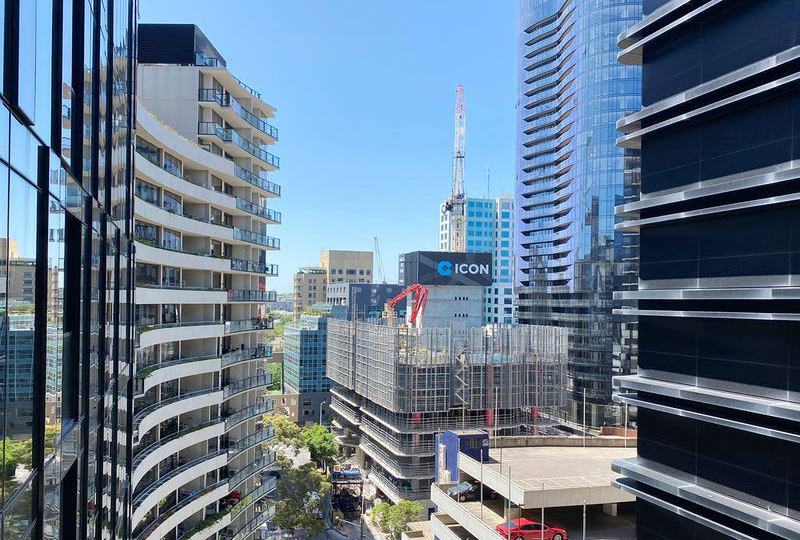
City of Ryde residential suburbs of Greater Sydney in Australia – aerial view towards distant city CBD on horizon.
Regional markets, as well as Brisbane and Adelaide are not seeing prices fall as quickly, as they continue to benefit from lifestyle and affordability preferences since the onset of the pandemic. So far, we see these benefits buffering these markets from the worst falls, but reversals of the pandemic-induced preference shifts presents a risk for these markets over the longer-term.
See July’s PropTrack Property Market Outlook for more on the extent of price falls PropTrack expects across the country.
While higher borrowing costs are a strong headwind for prices, the fundamentals of the property market remain sound. The Australian economy is performing well, with unemployment at close to a 50 year low. This will drive stronger wages growth which will increase borrowing capacities. Increased investor activity, as well as immigration, is likely to boost markets in large cities and units – which are now cheap relative to other property types.
As has been clear over recent months, the speed of interest rate hikes and wages growth remain the key unknowns for prices going forward.
* The PropTrack Home Price Index measures the monthly change in residential property prices across Australia to provide a current view on property market performance and trends. PropTrack Home Price Index uses a hybrid methodology combining repeat sales with hedonic regression. The repeat sales method matches resales of the same property while the hedonic regression estimates values based on the value of similar properties. The hybrid model allows two properties in the same Australian Bureau of Statistics Statistical Area 1 (SA1) region, of the same type, to be matched and controls for differences in property characteristics, as in a hedonic regression. The PropTrack Home Price Index is a revisionary index with the whole back history updated monthly with current transaction information.
** This report uses realestate.com.au internal data and data sourced from third parties, including State government agencies. It is current as at the time of publication. This report provides general information only and is not intended to constitute any advice and should not be relied upon as doing so. If you wish to cite or refer to this report (or any findings or data contained in it) in any publication, please refer to the report as the ’PropTrack Home Price Index Report – August 2022’. See report for Copyright and Legal Disclaimers.
Source: realestate.com.au