Vendor and buyer activity high, except in Victoria and Tasmania

May 31, 2024

In today’s Pulse, Tim Lawless analyses the increasing vendor and buyer activity nationwide.

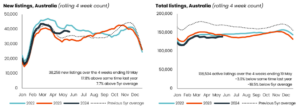
As we approach the cooler winter months the flow of new listings coming to market is slowing, but tracking well above the previous five-year average.

Over the past four weeks CoreLogic tracked 38,258 freshly advertised properties, almost 18% more than at the same time last year and 7.7% above the previous five year average.

The above average level of vendor activity may be tied to the previous dearth of listings as vendors sat on their hands during the early phase of the rate hiking cycle. Or, more home owners could be motivated to sell due to rising levels of financial pressure amid high interest rates and cost of living pressures. Or, some home owners may simply be looking to de-risk their balance sheets by cashing out of the market following a period of significant growth in values.

In reality, the higher level of vendor activity can probably be attributed to a combination of all these factors. In strong markets like Perth, Adelaide and Brisbane, sellers may feel incentivised by market conditions that remain skewed towards vendors, while in softer markets, where overall stock levels are elevated, it is buyers who generally hold the upper hand.

Almost every capital city and rest of state region has seen an increase in vendor activity relative to a year ago, except Hobart (-2.4%) where overall stock levels have been high for several years and values have recorded a substantial downturn since peaking in March 2022.

The other exceptions, but in the opposite direction, are Melbourne (+34.8% on a year ago) and Regional Victoria (+39.4%), which stand out with the largest jump in vendor activity. The larger rise in new listings across Victoria could be related to a combination of factors including high property taxes alongside a rising element of financial stress as high interest rates and cost of living pressures.

Most regions are showing enough buyer demand to absorb the higher than average flow of listings coming to market.

Despite the higher than average trend in new listings, nationally, the total number of homes advertised for sale is holding relatively flat, tracking -3.0% lower than a year ago and almost -19% below the previous five-year average.

However, listings are elevated in some markets.

The total number of advertised properties is sitting above the previous five-year average in Melbourne (+9.6%) and Hobart (+39.3%) as well as Regional Victoria (+29.7%) and Regional Tasmania (+21.9%).  Given the higher stock levels and generally soft selling conditions, these regions have generally seen softer value growth.

On the other hand, advertised stock levels remain extremely low in some markets, especially across Western Australia, South Australia and Queensland, where total listings are more than -34% below the previous five-year average.  Unsurprisingly, these regions are leading value gains nationally as buyers compete for a small pool of available properties.

Screenshot 2024 05 31 090033

Areas of Victoria dominate the top 20 list of SA3 regions

Areas of Victoria dominate the top 20 list of SA3 regions where total listings are most elevated relative to the previous five-year average, taking out the top eight places and comprising 11 of the top 20 overall. Areas of Tasmania were also over-represented in the list, comprising eight of the top 20 areas for the largest lift in listings.

Regional Victoria’s Ballarat has recorded the most substantial lift in listings, with stock levels 31.6% higher than a year ago and more than double the previous five-year average.  Stock levels in Ballarat have risen from a low base after moving through record lows during the pandemic, but have been on a persistent upwards trajectory since early 2022, fueling a -11.3% slump in dwelling values from the markets’ peak.

While areas of Regional Victoria dominate the highest rankings for the largest rise in total listings, the outer west and north west of Melbourne have also seen a large rise in advertised stock levels. The SA3’s of Sunbury, Macedon Ranges and Melton-Bacchus Marsh all recorded total listings more than 62% above the previous five-year average.  Dwelling values have trended lower in each of these markets, but remain well above pre-pandemic levels.

Outside of Victoria and Tasmania, the only other regions to feature in the top 20 largest increase in total listings were Rouse Hill-McGraths Hill in Sydney and the Snowy Mountains SA3, located in the Capital Region of Regional NSW.

Rural areas of QLD, SA and WA had the most significant listing drops

The most significant drops in total listings relative to the previous five-year average were concentrated in rural areas of Queensland, South Australia and Western Australia. Rural areas of Queensland comprised the top three places on the leagues table and made up eight positions in the overall top 20.  In many cases, these areas saw listing numbers fall from extremely high levels leading into the pandemic.  The trend towards lower listings in these markets is being fuelled by a combination of housing affordability and the changed demographic patterns that favoured regional markets during the pandemic.

Most of these regions have seen total listings either stabilise around decade lows or continue to trend lower as demand continues to outweigh supply.

The only two capital city SA3 regions to make the top 20 list for the largest decrease in listings were located in Perth (Kwinana) and Brisbane (Beaudesert), with both of these regions offering an extremely affordable median value relative to the broader metro average.


Source: corelogic.com.au

You might be also interested in

REA Group Rental Affordability Report – 2025
Rental affordability has worsened in the past 12 months, hitting its lowest level since at least 2008, when records began, according to the PropTrack Rental Affordability Index. Rental affordability is toughest
VIEW POST
Istock 950975006 E1727416074837
Latest inflation figures dash hopes of imminent second rate cut
New inflation data from the Australian Bureau of Statistics (ABS) this week has cast doubt on whether Australians will be in line for a second rate cut in April. The
VIEW POST
Screenshot 2025 03 05 105838
PwC’s CityPulse 2025: Analysing Melbourne’s liveability
In 2025, the most liveable suburbs are those that allow people a short commute to work, plenty of amenities such as bars and restaurants as well as good access to
VIEW POST
Coburg Library 1 1536x1536
Neighbourhood Guide – Coburg
Coburg, Victoria, is a suburb that blends rich history with contemporary charm. Originally known as Pentridge, the area was renamed Coburg in the 1860s, inspired by the German town of
VIEW POST
B625b37a 9c7a 4b7c 9e83 C82c4d6fdd0c
Boost in investor activity offers relief to renters
Investor loans have been trending upwards for the past few quarters and are now above the five year average. This is contributing to an increase in rental supply and a
VIEW POST
Ire3354576 Footscray 2024 11 28 001813 17
Melbourne’s most affordable suburbs with units under $500,000 within 5km of the CBD
The property search often comes with compromise, but not for these eight remaining Melbourne suburbs located within five kilometres of the CBD and with a median unit price under $500,000.
VIEW POST
Ire3354913 Cairnlea 2025 02 16 224818 13
Melbourne’s cheapest suburbs within 5km and 10km of the CBD
Melbourne’s hopeful home buyers can find better value by looking to the west of the city, where houses can still be purchased for less than $1 million. For many Melbourne
VIEW POST
Ire3753530 Melbourne 2025 01 06 025719 9
Surprise locations where more homeowners are selling up
In 2024, more homeowners listed their properties than in the previous two years, signalling increased seller confidence despite numerous interest rate hikes. Nationally, new listings rose by 7.9% in 2024
VIEW POST
Suburbs that exited the million-dollar club
Home price growth slowed over 2024 and declined over the quarter ending January as buyers had more choices and faced ongoing affordability challenges. The trend has been even more evident
VIEW POST
December 2024 House Price Report
Home prices across the combined capitals continued to climb over the final quarter of 2024, marking the eighth consecutive quarter of growth for houses and the seventh for units, with
VIEW POST

Get your Free Property Guide.

Here goes your text ... Select any part of your text to access the formatting toolbar.

Get your free Sales Report for Vendor and buyer activity high, except in Victoria and Tasmania

Get your free Sales Report for Vendor and buyer activity high, except in Victoria and Tasmania

Subscribe to hear the latest

Start The Conversation Today.

Call us on:

1300 850 730

Privacy Policy

Get your Free Property Guide

Get your free Suburb Report for Vendor and buyer activity high, except in Victoria and Tasmania

Get your Free PDF copy of Make Money Simple Again

Privacy Policy

Who we are

Suggested text: Our website address is: https://motionproperty.com.au.

Comments

Suggested text: When visitors leave comments on the site we collect the data shown in the comments form, and also the visitor’s IP address and browser user agent string to help spam detection.

An anonymized string created from your email address (also called a hash) may be provided to the Gravatar service to see if you are using it. The Gravatar service privacy policy is available here: https://automattic.com/privacy/. After approval of your comment, your profile picture is visible to the public in the context of your comment.

Media

Suggested text: If you upload images to the website, you should avoid uploading images with embedded location data (EXIF GPS) included. Visitors to the website can download and extract any location data from images on the website.

Cookies

Suggested text: If you leave a comment on our site you may opt-in to saving your name, email address and website in cookies. These are for your convenience so that you do not have to fill in your details again when you leave another comment. These cookies will last for one year.

If you visit our login page, we will set a temporary cookie to determine if your browser accepts cookies. This cookie contains no personal data and is discarded when you close your browser.

When you log in, we will also set up several cookies to save your login information and your screen display choices. Login cookies last for two days, and screen options cookies last for a year. If you select “Remember Me”, your login will persist for two weeks. If you log out of your account, the login cookies will be removed.

If you edit or publish an article, an additional cookie will be saved in your browser. This cookie includes no personal data and simply indicates the post ID of the article you just edited. It expires after 1 day.

Embedded content from other websites

Suggested text: Articles on this site may include embedded content (e.g. videos, images, articles, etc.). Embedded content from other websites behaves in the exact same way as if the visitor has visited the other website.

These websites may collect data about you, use cookies, embed additional third-party tracking, and monitor your interaction with that embedded content, including tracking your interaction with the embedded content if you have an account and are logged in to that website.

Who we share your data with

Suggested text: If you request a password reset, your IP address will be included in the reset email.

How long we retain your data

Suggested text: If you leave a comment, the comment and its metadata are retained indefinitely. This is so we can recognize and approve any follow-up comments automatically instead of holding them in a moderation queue.

For users that register on our website (if any), we also store the personal information they provide in their user profile. All users can see, edit, or delete their personal information at any time (except they cannot change their username). Website administrators can also see and edit that information.

What rights you have over your data

Suggested text: If you have an account on this site, or have left comments, you can request to receive an exported file of the personal data we hold about you, including any data you have provided to us. You can also request that we erase any personal data we hold about you. This does not include any data we are obliged to keep for administrative, legal, or security purposes.

Where your data is sent

Suggested text: Visitor comments may be checked through an automated spam detection service.