In this spring preview, Tim Lawless analyses new and total listings compared to the previous five-year average, which regions have had the largest rise/fall in advertised stock levels and reveals where real estate agent activity is ramping up.
The flow of new listings added to the Australian housing market has been rising since mid-June, in contrast to the usual seasonal trend where new vendor activity would be trending lower through the colder months.
Historically, based on the pre-COVID decade average, new listings added to the national housing market drop by 5.2% between autumn and winter before rising by an average of 9.8% between winter and spring. In contrast, through the winter season to-date, new listings have risen by 13.2% this year, driven mostly by a 17.9% rise across the capital cities compared with a 4.6% rise in the flow of new listings across the combined regional areas of the country.
Over the four weeks ending August 13, the number of new listings added to the Australian housing market was 3.3% above the previous five-year average; the first time we have seen the flow of new listings rise above the five-year benchmark since September last year.
The counter seasonal lift in vendor activity can probably be attributed to the positive turn in housing values across most regions since March alongside historically low advertised supply levels working to boost vendor confidence. As noted by CoreLogic in May, there is a positive correlation between rising housing values and a lift in new listings.
Anecdotally, we may also be seeing more home owners needing to sell amid a peak in the ‘fixed rate cliff’, elevated interest rates and high cost of living pressures. Data on mortgage arrears continues to show a historically small portion of borrowers are behind on their mortgage repayments, however we are likely to see mortgage stress becoming more evident through the second half of the year.
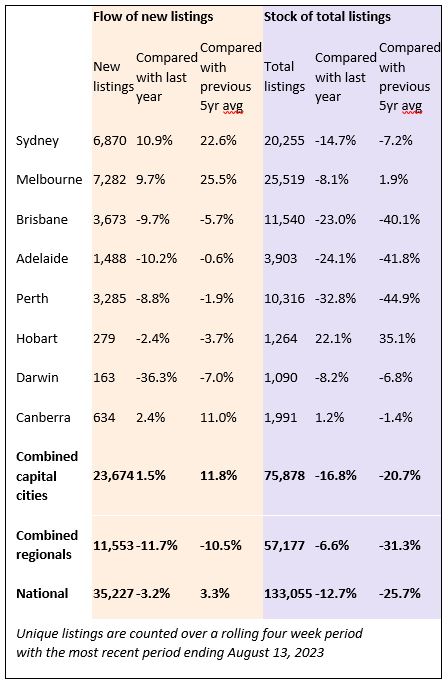
Most of the broad regions of Australia are recording a rise in the number of fresh listings coming to market, but the lift is generally from a low base and driven by the capital cities. Compared to the same period a year ago, new listings are up 1.5% across the combined capitals but down 11.7% across the combined regional markets.
Focusing on the capitals, the only cities to record a higher number of new listings relative to a year ago are Sydney (+10.9%), Melbourne (+9.7%) and the ACT (+2.4%).
Each of these cities is now recording a new listing trend that is above the previous five-year average as well. The remaining capitals are all recording a rise in the number of new listings through winter, but not enough to push fresh stock levels higher than a year ago or above the previous five-year benchmark.
Regional listing trends haven’t shown the same uplift. Since the beginning of winter, the trend in new listings is up 4.6% across the combined regional areas of Australia, but holding 11.7% below levels recorded a year ago and 10.5% below the previous five-year average.
Regional Victoria is the only broad rest of state region to record a higher number of fresh listings relative to a year ago, but only marginally at 0.9%. Similarly, Regional Victoria is the only regional market where new listings are above the previous five-year benchmark (+4.2%).
While the number of new listings is rising across most regions, total advertised supply generally remains tight. Unlike ‘new’ listings, ‘total’ refers to the count of all advertised homes for sale in the reference period, not just those that were newly added to the market over time. Since the beginning of winter, total advertised supply has reduced by 3.5% despite a 13.2% rise in the flow of new listings. However, more recently as the flow of new listings gathers some pace, demand hasn’t quite kept pace. The past four weeks has seen advertised stock levels edging 0.3% higher, led by a 2.2% rise in total listings across the capitals and offset by a 2.2% fall across the combined regional areas.
Sydney has led the month-on-month rise in total advertised stock levels, up 5.3% over the four weeks ending August 13, followed by Melbourne (+4.4%) and Canberra (+4.3%).
Only two capital cities are recording total advertised stock levels higher than at the same time last year: Hobart (+22.1%) and Canberra (+1.2%). Compared with the previous five-year average, listings are now higher in Melbourne (+1.9%) and Hobart (+35.1%).
At the other end of the spectrum is Perth, where total listing numbers are trending lower alongside a relatively flat trend in fresh listings and above average purchasing activity. Advertised stock across Perth is now 44.9% below the previous five-year average. Adelaide (-41.8%) and Brisbane (-40.1%) are also showing extremely tight levels of available supply relative to the previous five-year average.
Cities where advertised supply levels have risen have also seen a reduction in the pace of value growth. Sydney home values were rising at the monthly rate of 1.8% in May, halving to 0.9% by the end of July and slowing further in August based on changes in CoreLogic’s daily index. Melbourne’s pace of value growth has eased from 0.9% in May to 0.3% in July and home values edged 0.1% lower across the ACT in July.
Cities with tight supply levels have seen accelerated value growth, with CoreLogic’s daily index showing a 1.2% rise in Perth values over the past four weeks, a 1.4% lift in Brisbane values and a 1.5% rise across Adelaide.
Considering advertised supply levels are now starting to rise in some cities, selling conditions in these areas are likely to become more competitive through spring. More choice and less urgency is a positive outcome for buyers, but it could see an easing in auction clearance rates and longer selling times unless we see a commensurate lift in buyer demand alongside higher advertised supply levels.
With consumer sentiment holding around the same lows as the global financial crisis and early phase of the pandemic, and credit conditions remaining tight, it’s hard to see a material lift in purchasing activity ahead.
Where has the largest rise in advertised stock levels occurred relative to the previous five year average?
The largest percentage change in total advertised stock levels has occurred across areas of Regional Victoria, Melbourne and Hobart, with SA3’s located in these areas comprising 17 of the top 20 largest rises in advertised stock levels relative to the previous five-year average.
Although advertised listings are substantially above the five-year average in each of these locations, in many cases, stock levels are rising from extremely low levels. This is particularly the case in parts of regional Australia where demand-side factors have eased as internal migration patterns normalise.
Other areas, such as Stonnington East and Essendon in Melbourne are showing the opposite trend, where despite being above average, advertised supply levels are actually trending lower from a relatively high base following an accrual of advertised supply through the pandemic.
Where has the largest drop in advertised stock levels occurred relative to the previous five year average?
Regional areas of WA, SA and Queensland comprise 16 of the top 20 SA3’s where advertised supply levels have dropped below the previous five-year average. Most of these areas have recorded a steady decline in advertised stock levels since the onset of the pandemic as demand outpaces supply in these regions.
Although advertised stock levels are already extremely low, at least by a historical standpoint, many of these regions continue to see a trend towards less stock on market amid an insufficient flow of new listings to meet demand.
The capital city regions included on the top 20 list were located in Perth (2 SA3’s), Brisbane (1) and Adelaide (1), with each of these areas located around the outer fringes of the metro area.
Based on activity from industry participants on CoreLogic’s RP Data platform, the real estate sector is becoming more active. Since the first week of July, the number of pre-listing reports generated by real estate agents has been tracking higher than a year ago and well above pre-COIVD levels (based on activity at the same time of the year in 2019).
Nationally, over the week ending August 13, agent activity was 14.8% higher than at the same time last year, 10.0% higher than in 2021 and 31% above levels in 2019.
Although advertised stock levels are the lowest relative to average levels in WA, SA and Queensland, these are the states where real estate agent activity has increased the most over the past four weeks, signaling a rise in fresh listings could be on the way in these regions.
Activity from real estate agents was 7.5% higher over the past four weeks in WA, 5.7% higher across SA and up 5.4% in Queensland. Tasmania, where stock levels are already elevated, has also seen a substantial rise in real estate agent activity over the past four weeks, lifting 6.1%.
The two most populous states, NSW and Victoria, where listings have been higher relative to the five-year average, have seen a smaller rise, probably reflecting an earlier rise in activity, as seen in the sharper lift in new listings since early July.
The trend in listings will be a critical factor to monitor over the coming months. The spring season is shaping up to be a busy one, making up for the relatively sedate spring and early summer selling season last year.
Through the recent recovery phase to-date, low available supply levels have been the key factor supporting value growth. A rise in stock levels could signal a further easing in the pace of capital gains across Australian housing markets as buyers benefit from a broader selection of available housing.
Source: corelogic.com.au